Beyond the Big Crunch of Excel:
The Big Bang of Digital Visualizations


Marcus Adams

April 10, 2019

At a time when slide rules roamed the land…

…one man, JonJohn Snow, would dare to visualize…

…and change public health forever

Plots in the Time of Cholera

If You’re Looking For Advice

Some References

  • Berinato, Scott. “Data Science and the Art of Persuasion.” Harvard Business Review, January-February 2019, pp. 126–137, http://hbr.org/2019/01/data-science-and-the-art-of-persuasion.
  • Berinato, Scott. Good Charts: the HBR Guide to Making Smarter, More Persuasive Data Visualizations. Harvard Business Review Press, 2016.
  • Brinton, Willard Cope. Graphic Methods for Presenting Facts. Engineering Magazine Company, 1919.
  • Chen, Chun-houh, et al. Handbook of Data Visualization. Springer, 2016.
  • Cleveland, William S. The Elements of Graphing Data. AT&T Bell, 1994.

Some More

  • Cook, Dianne, and Deborah F. Swayne. Interactive and Dynamic Graphics for Data Analysis with R and GGobi. Springer Science+Business Media, LLC, 2008.
  • Dzemyda, Gintautas, et al. Multidimensional Data Visualization: Methods and Applications. Springer Science+Business Media, 2013.
  • Ellis, Laura. “Little Miss Data - Weird Graphs.” Little Miss Data, http://www.littlemissdata.com/search?q=weird%20graphs.
  • Healy, Kieran. Data Visualization: A Practical Introduction. Princeton University Press, 2019.

Even More

  • Huff, Darrell, and Irving Geis. How to Lie with Statistics. W.W. Norton & Co., 2006.
  • Lidwell, William, et al. Universal Principles of Design: 125 Ways to Enhance Usability, Influence Perception, Increase Appeal, Make Better Design Decisions, and Teach through Design. Rockport, 2010.
  • Postman, Neil. Amusing Ourselves to Death: Public Discourse in the Age of Show Business. Simon Fraser University, 2007.
  • “Results - The Visual Display of Data.” Biomedical Research: How to Plan, Publish, and Present It, by W. F. Whimster et al., Springer, 1997, pp. 70–93.

Yet Still More

One More ‘More’

  • Tufte, Edward Rolf. The Visual Display of Quantitative Information. Graphics Press, 2015.
  • Wickham, Hadley. “A Layered Grammar of Graphics.” Journal of Computational and Graphical Statistics, Vol. 19, No. 1, 2010, pp. 3–28., doi:10.1198/jcgs.2009.07098.
  • Wilke, Claus O. Fundamentals of Data Visualization: A Primer on Making Informative and Compelling Figures. O’Reilly Media, 2018.
  • Wilkinson, Leland. Grammar of Graphics. Springer, 2012.
  • Zhu, Ying. “Measuring Effective Data Visualization.” Advances in Visual Computing Lecture Notes in Computer Science, Part III, 2007, pp. 652–661., doi:10.1007/978-3-540-76856-2_64.

Be Purposeful

Philosophical Considerations

Pragmatic Considerations

Be Deliberate

Elementary Graphical-Perception Tasks (Cleveland 1985)

  1. Position Along Common Axis
  2. Position on Identical, Nonaligned Scales
  3. Length
  4. Angle
  5. Slope
  6. Area
  7. Volume/Density/Color Saturation
  8. Color Hue


Be Consistent

Not Every Plot Deserves Its Own Theme

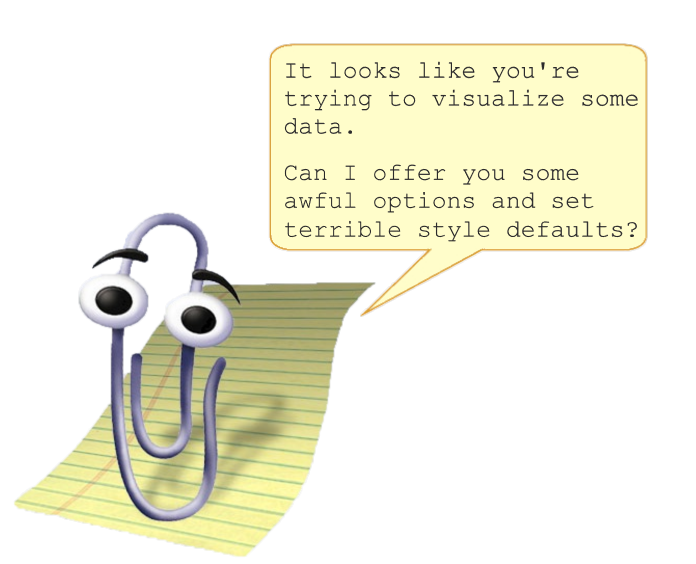
Then There Was Excel…

These defaults are not ok...
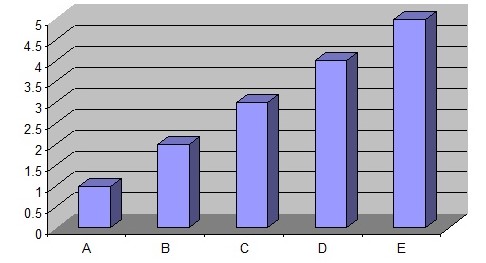
“That’s an appropriate
use of a 3D bar chart”
—No One Ever

Welcome to a Digital World

Digital Production

The Digital Triad of Power

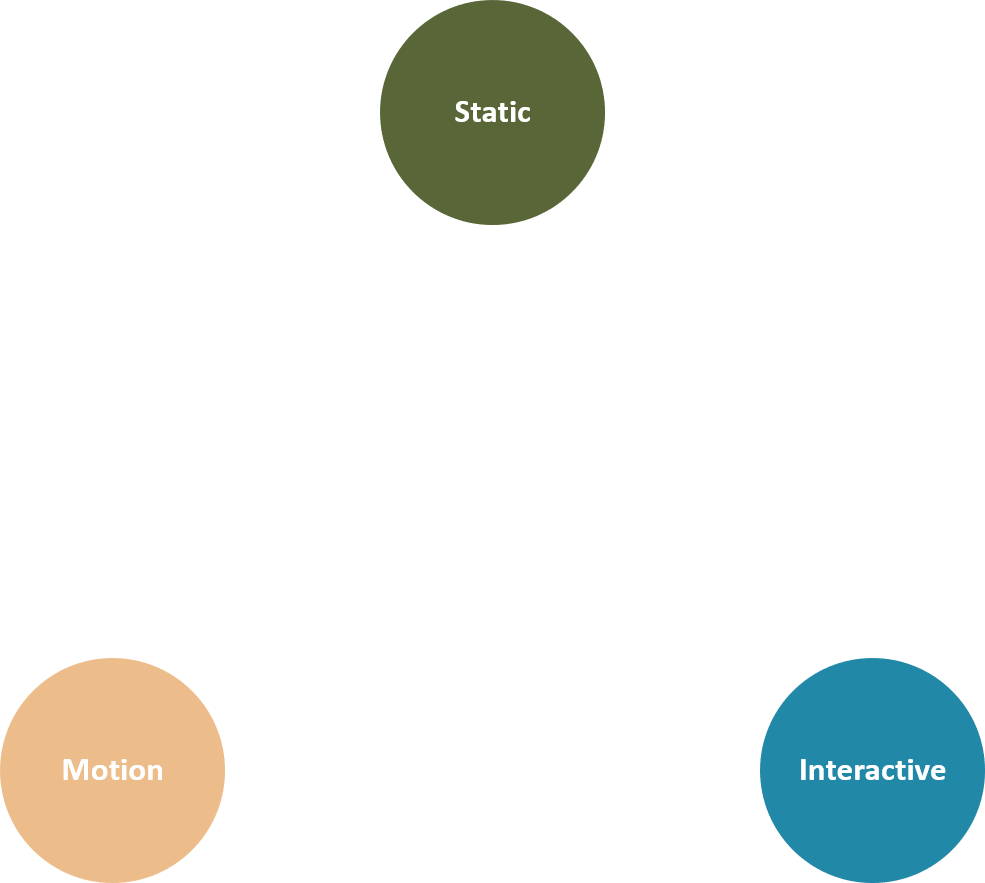
Static Digital Visualizations

Interactive Visualizations

Motion Visualizations

Not Just For Camping Equipment

R - Reproducible

E - Extensible

I - Integratable

Computers have enabled people to make more mistakes faster than almost any invention in history, with the possible exception of tequila and handguns.
— Mitch Ratcliffe